Data My WayTM
A powerful toolset that simplifies the way users synthesize data on websites.
Data My Way™ gives users better control of quantitative data on your website and improves their online experience.
Contact us to arrange for a demonstration. Sign Up
It’s often said that a picture is worth a thousand words. For many, financial, industry and operational data is dense, complicated and difficult to digest. If given the choice of information presented in a text or simplified visual format (such as a chart or graph), people generally prefer visuals that make data interpretation easier.
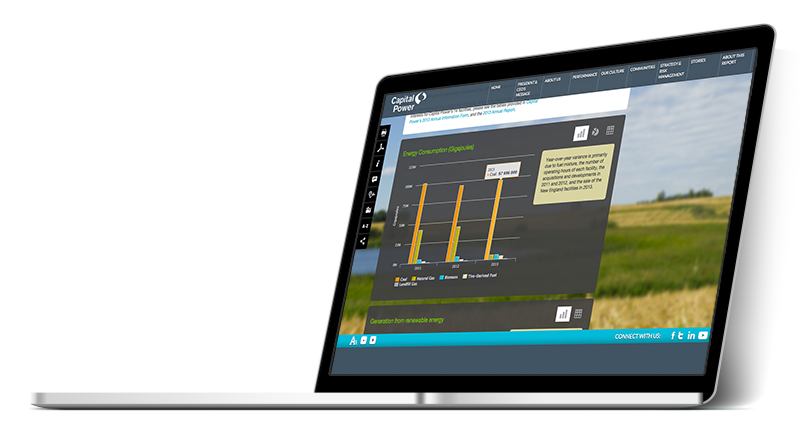
Sutton Integrated’s Data My Way™ is a powerful, innovative and easy to use web-based toolset that offers website visitors control over how they want data presented on screen. For websites that contain industry data, operating and financial information, and other quantitative information, deployment of Data My Way™ keeps users on your site longer by making access, presentation and use of information easier than ever.
With a few clicks of a mouse, a bar graph, pie chart or data table is presented on screen in real time. Users can hide or reveal portions of any charts or graph created. Information can then be downloaded into a number of formats for use in presentations, or as a printed PDF document. And of course, like most of Sutton Integrated’s innovative web technology, information is easily maintained and controlled inside of the Sutton Integrated Content Management System (CMS).